Accessing historical telemetry
Goal
In this tutorial you will:
Power on DPU board to generate several minutes of telemetry data
Access historical telemetry data from Smart Mission Lab system
Prerequisites
Active subscription within Smart Mission Lab system
Active VPN connection to Smart Mission Lab system
Access to EGSE Host
Board prepared to run Linux distribution
For Antelope use Linux distribution built in Zero to hero tutorials
A bit of background
When board’s supervisor is running, Smart Mission Lab system continuously monitors telemetry readouts from board. Customer can access collected values using Grafana web application.
Generate telemetry data
Log in to EGSE Host using SSH
user@my-machine:~$ ssh customer@egse-my-egse.egse.vpn.sml.kplabs.space
customer@egse-my-egse:~$
Power on board
customer@egse-my-egse:~$ sml power on
Powering on...Success
customer@egse-my-egse:~$ sml power on Powering on...SuccessWait 2 minutes
Power on DPU
customer@egse-my-egse:~$ sml dpu power on
Powering on...Success
customer@egse-my-egse:~$ sml dpu reset off
Bringing DPU out of reset...Success
customer@egse-my-egse:~$ sml pn1 power on Powering on...Success
Access historical telemetry
Open https://grafana.vpn.sml.kplabs.space in your web browser
Grafana will redirected you to Customer Dashboard for sign-in. Log-in using your credentials
After successful login, you will go back to Grafana home page automatically
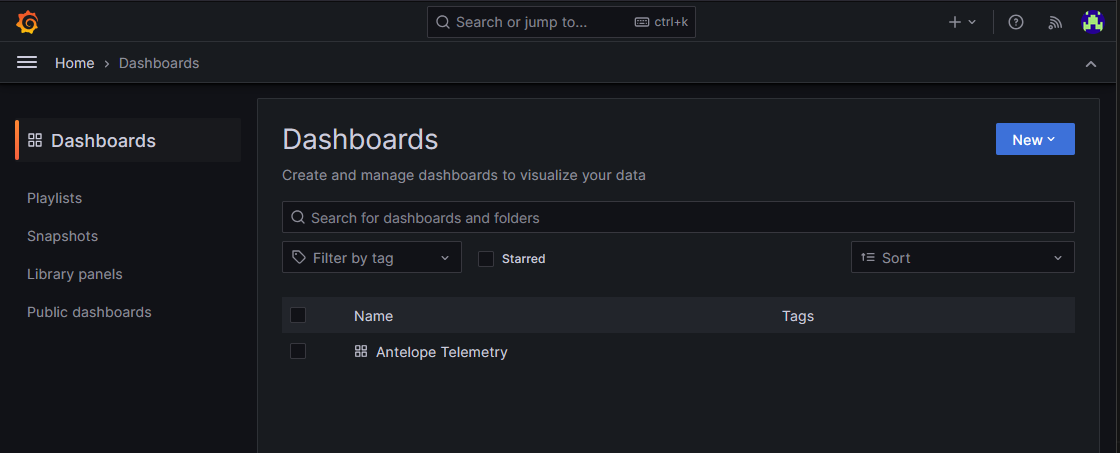
Fig. 16 Dashboards available after logging in
Open dashboard with telemetry for your board (for Antelope use , for Leopard use )
Select board to display telemetry by selecting name of your EGSE Host in dropdown at the top of the dashboard
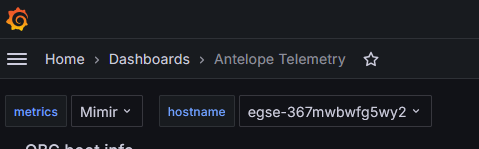
Fig. 17 Select board to display by switching EGSE Host name
Select time range that contains this tutorial by selecting
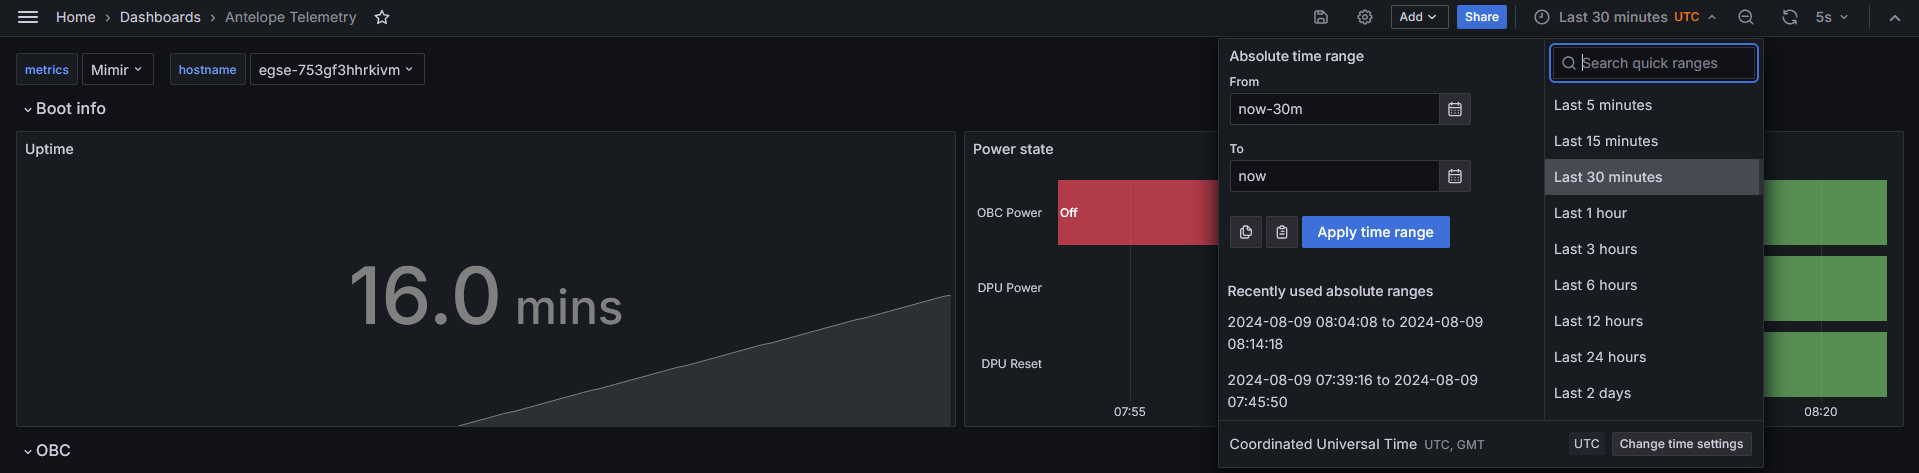
Fig. 18 Select time range to display
Note
If you performed first part of this tutorial (powering on board) more than 30 minutes ago, you can select different time range. Use longer ‘last ..’ selection or enter absolute times to show data gathered during this tutorial.
Dashboard now displays telemetry data from your board.
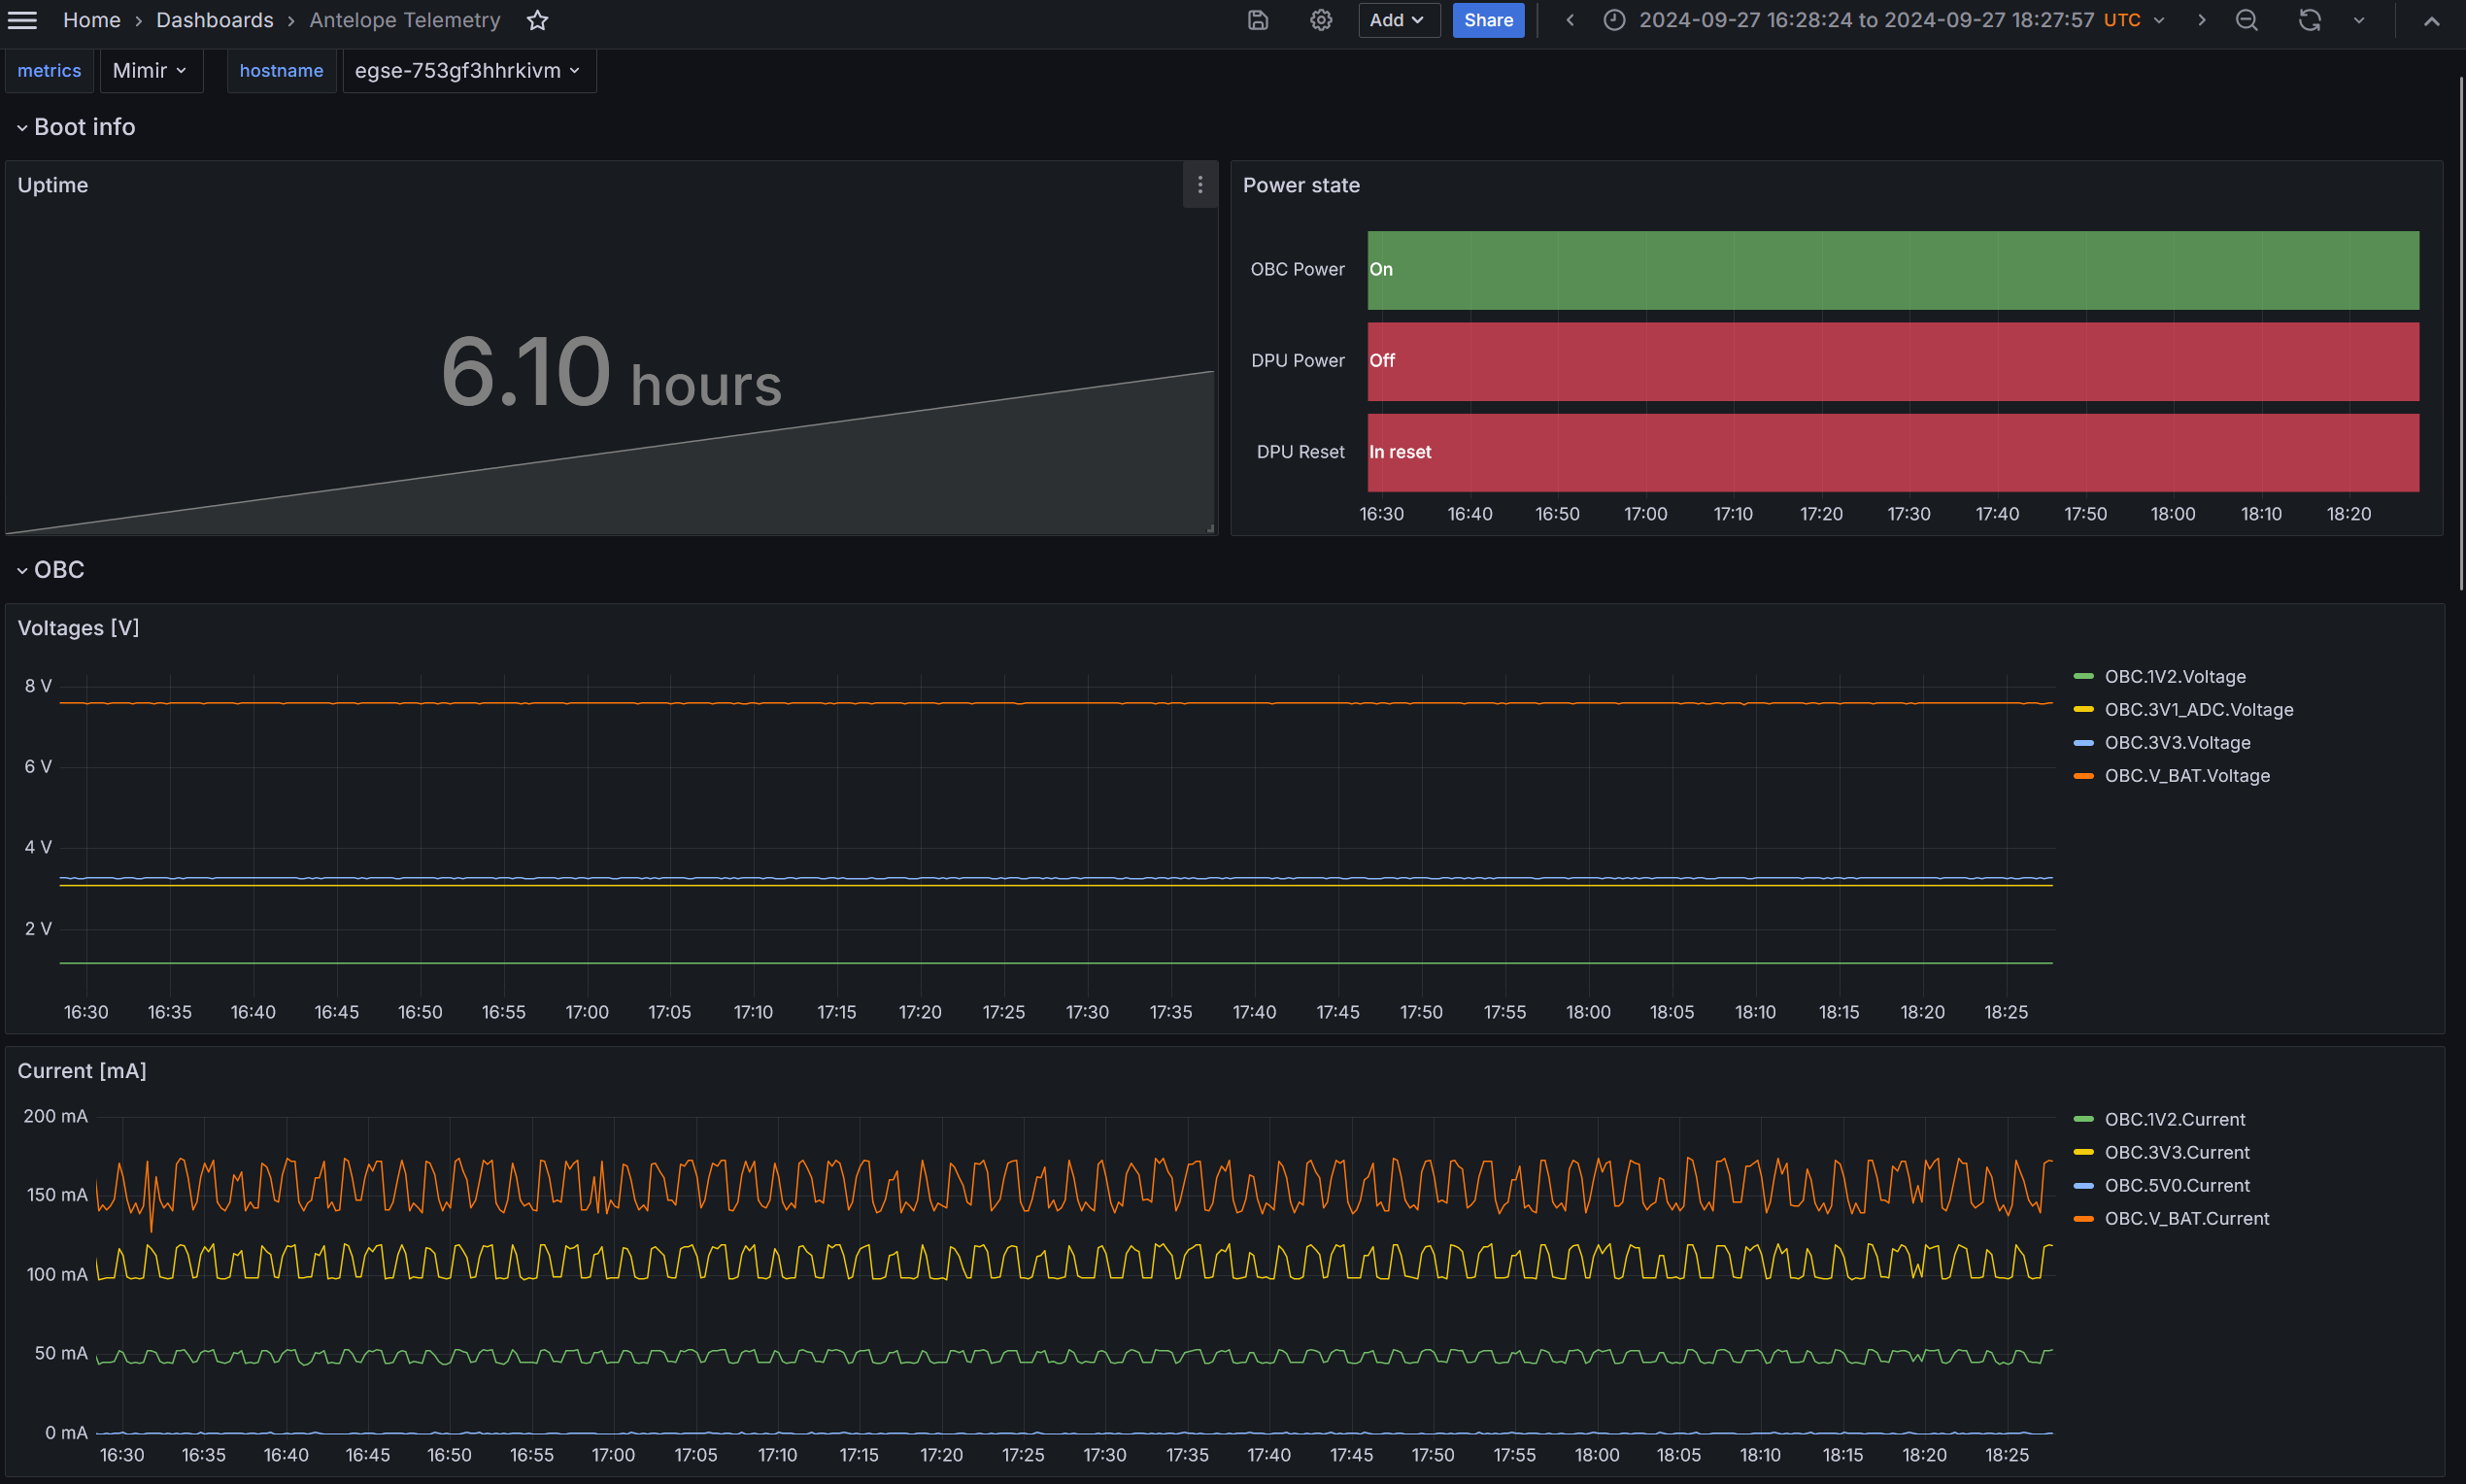
Fig. 19 Example of Antelope Telemetry dashboard
Summary
SML infrastructure constantly monitors and collects telemetry readouts from boards. At any point in time, you can use Grafana to review collected data.